Cloud Intelligence Dashboards
The Cloud Intelligence Dashboards is an open-source framework, lovingly cultivated and maintained by a group of customer-obsessed AWSers, that provides customers actionable insights and optimization opportunities at scale of organization. Supported by the Well-Architected framework, the dashboards can be deployed by any customer using a CloudFormation template or a command-line tool in their environment. These dashboards help customers drive financial accountability, optimize cost, track usage goals, implement best-practices for governance, and achieve operational excellence across all Well Architected pillars.
Foundational Dashboards
| Dashboard | | Links | Audience |
|---|
| CUDOS Dashboard provides you high level details and operational insights with ability drill down to resource level granularity. In CUDOS dashboard you can find auto-generated cost optimization recommendations and actionable insights which can be used by your FinOps practitioners, Product Owners and Engineering teams out of the box. It allows you to quickly identify spikes and uncover uncertainties in your AWS usage with highlighting particular resources which can be optimized. | 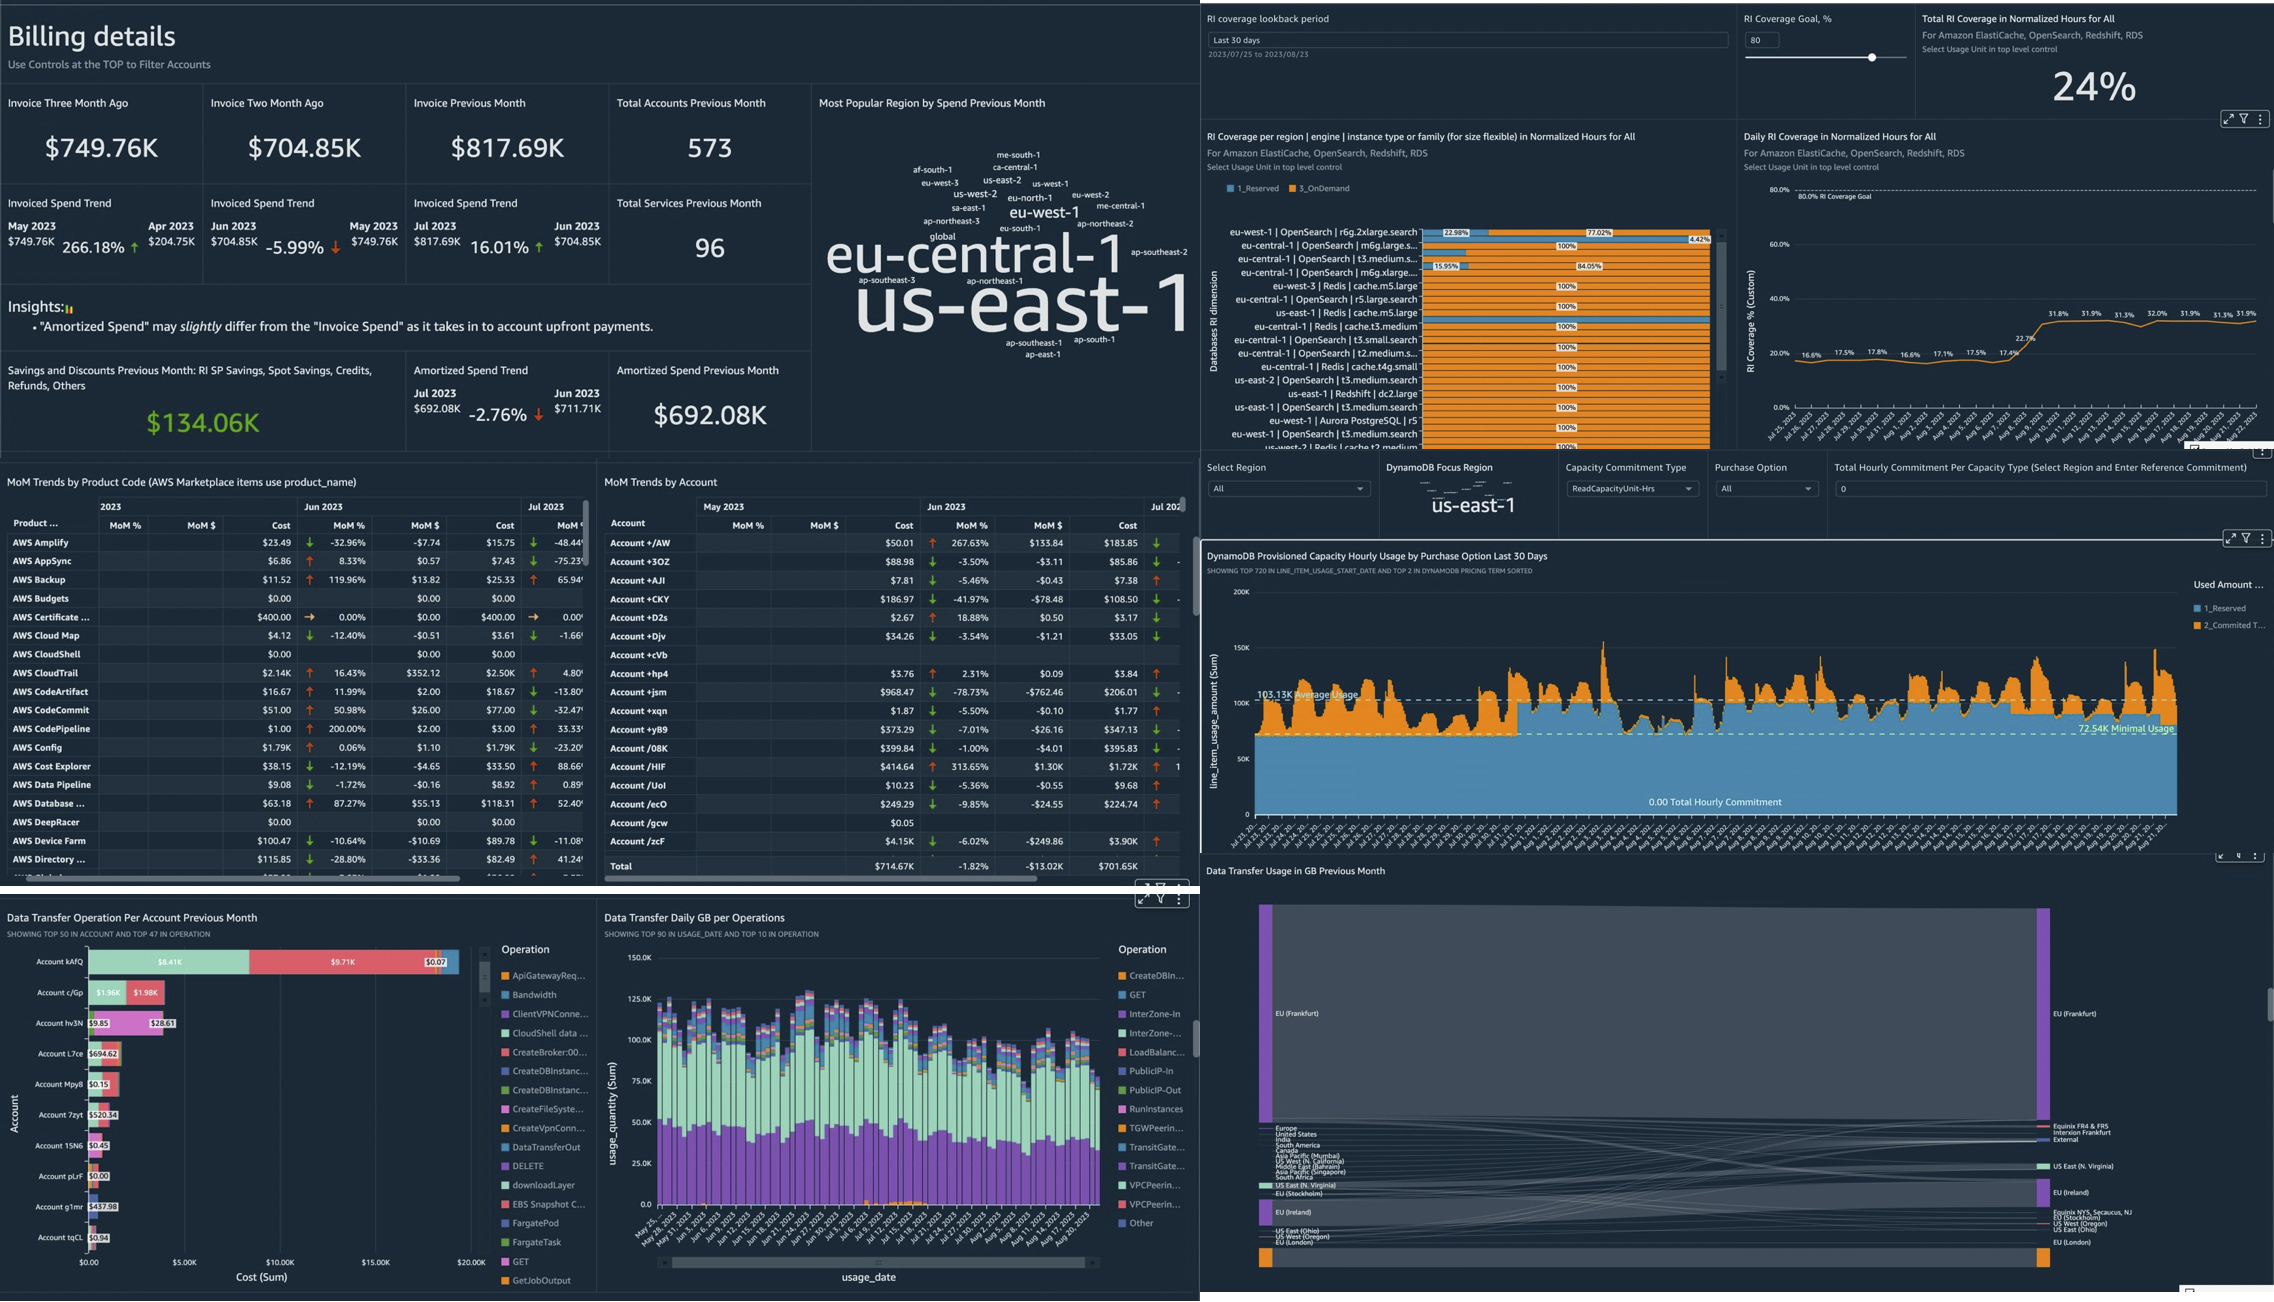 | Demo Details Deploy Feedback | Product Owners, Finance, FinOps, DevOps, Engineering teams |
| Cost Intelligence Dashboard is a customizable and accessible dashboard to help create the foundation of your own cost management and optimization tool. Executives, directors, and other individuals within the CFO’s line of business or who manage cloud financials for an organization will find the Cloud Intelligence Dashboard easy to use and relevant to their use cases. Little to no technical knowledge or understanding of AWS Services is required | 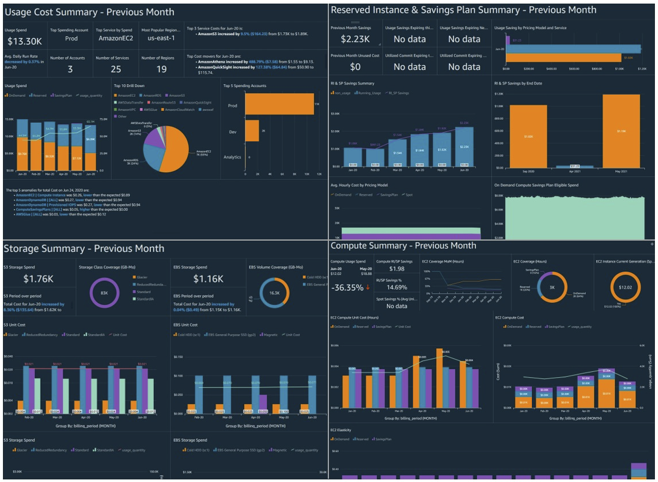 | Demo Details Deploy Feedback | Executives, Finance/Procurement |
| The KPI and Modernization Dashboard helps your organization combine DevOps and IT infrastructure with Finance and the C-Suite to grow more efficiently and effectively on AWS. This dashboard lets you set and track modernization and optimization goals such as percent OnDemand, Spot adoption, and Graviton usage. By enabling every line of business to create and track usage goals, and your cloud center of excellence to make recommendations organization-wide, you can grow more efficiently and innovate more quickly on AWS | 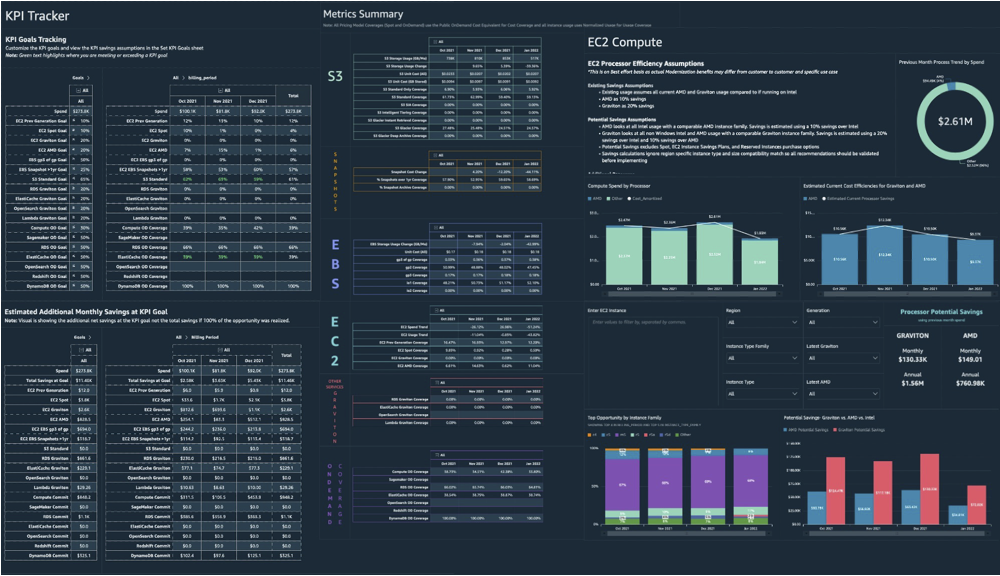 | Demo Details Deploy Feedback | Product owners, Finance, FinOps, DevOps, Engineering teams |
Advanced Dashboards
| Dashboard | | Links | Audience |
|---|
| Trusted Advisor Organizational (TAO) Dashboard provides you visibility for all cost optimization opportunities and auto-identified idle resources together with highlighted by AWS Trusted Advisor risks and flagged resources across Security, Reliability and Performance pillars. TAO provides historical trends allowing you to track results of optimizations | 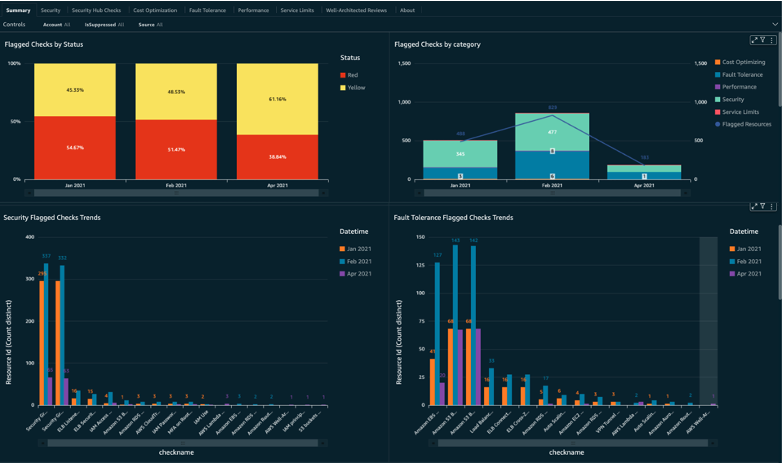 | Demo Details Deploy Feedback | Product owners, FinOps, DevOps, Engineering, SRE, Security teams |
| Compute Optimizer Dashboard helps your organization to visualize and trace right sizing recommendations from AWS Compute Optimizer. These recommendations will help you identify Cost savings opportunities for over provisioned resources and also see the Operational risk from under provisioned ones | 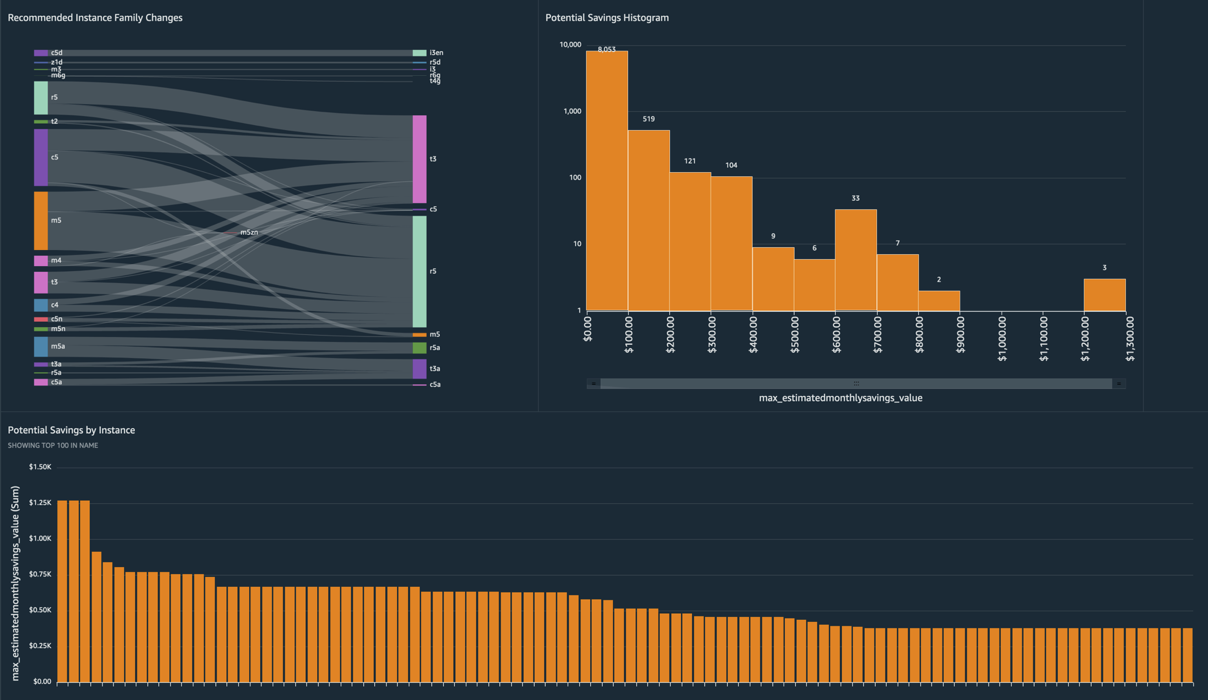 | Demo Details Deploy Feedback | Product owners, FinOps, DevOps, Engineering teams |
| Cost Anomaly Dashboard helps you to track and visualize findings from AWS Cost Anomaly Detection. | 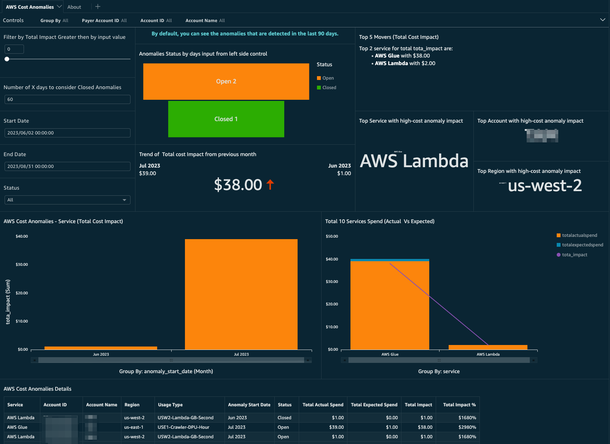 | Details Deploy Feedback | Product owners, FinOps, DevOps, Engineering teams |
Additional Dashboards
| Dashboard | Preview | Links | Audience |
|---|
| Trends Dashboard provides Financial and Technology organizational leaders access to proactive trends, signals, insights and anomalies to understand and analyze their AWS cloud usage | 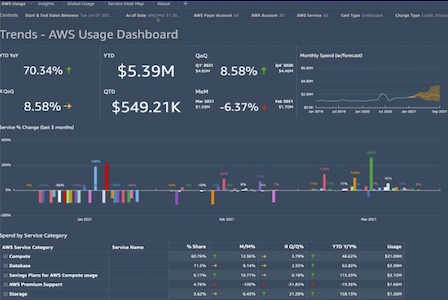 | Demo Details Deploy Feedback | Executives, Finance/Procurement |
| Sustainability Proxy Metrics Dashboard helps customers look for opportunities to reduce a customer’s sustainability impact by making changes to their AWS infrastructure. This dashboard shows resource use in key areas defined in the Sustainability Pillar of the Well Architected Framework. It helps customers implement an impact aware architecture. It also acts as a starting point for customers to implement business metrics as defined in the Well Architected Framework | 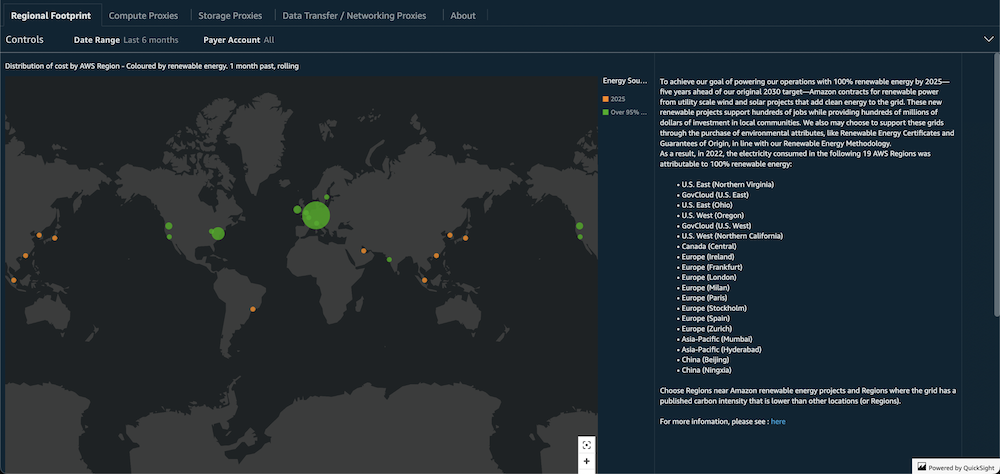 | Demo Details Deploy | Product owners, FinOps, DevOps, Engineering teams |
| Cloud Intelligence Dashboard for Azure, a solution that allows you to create Azure cost visualizations and reports in Amazon QuickSight. | 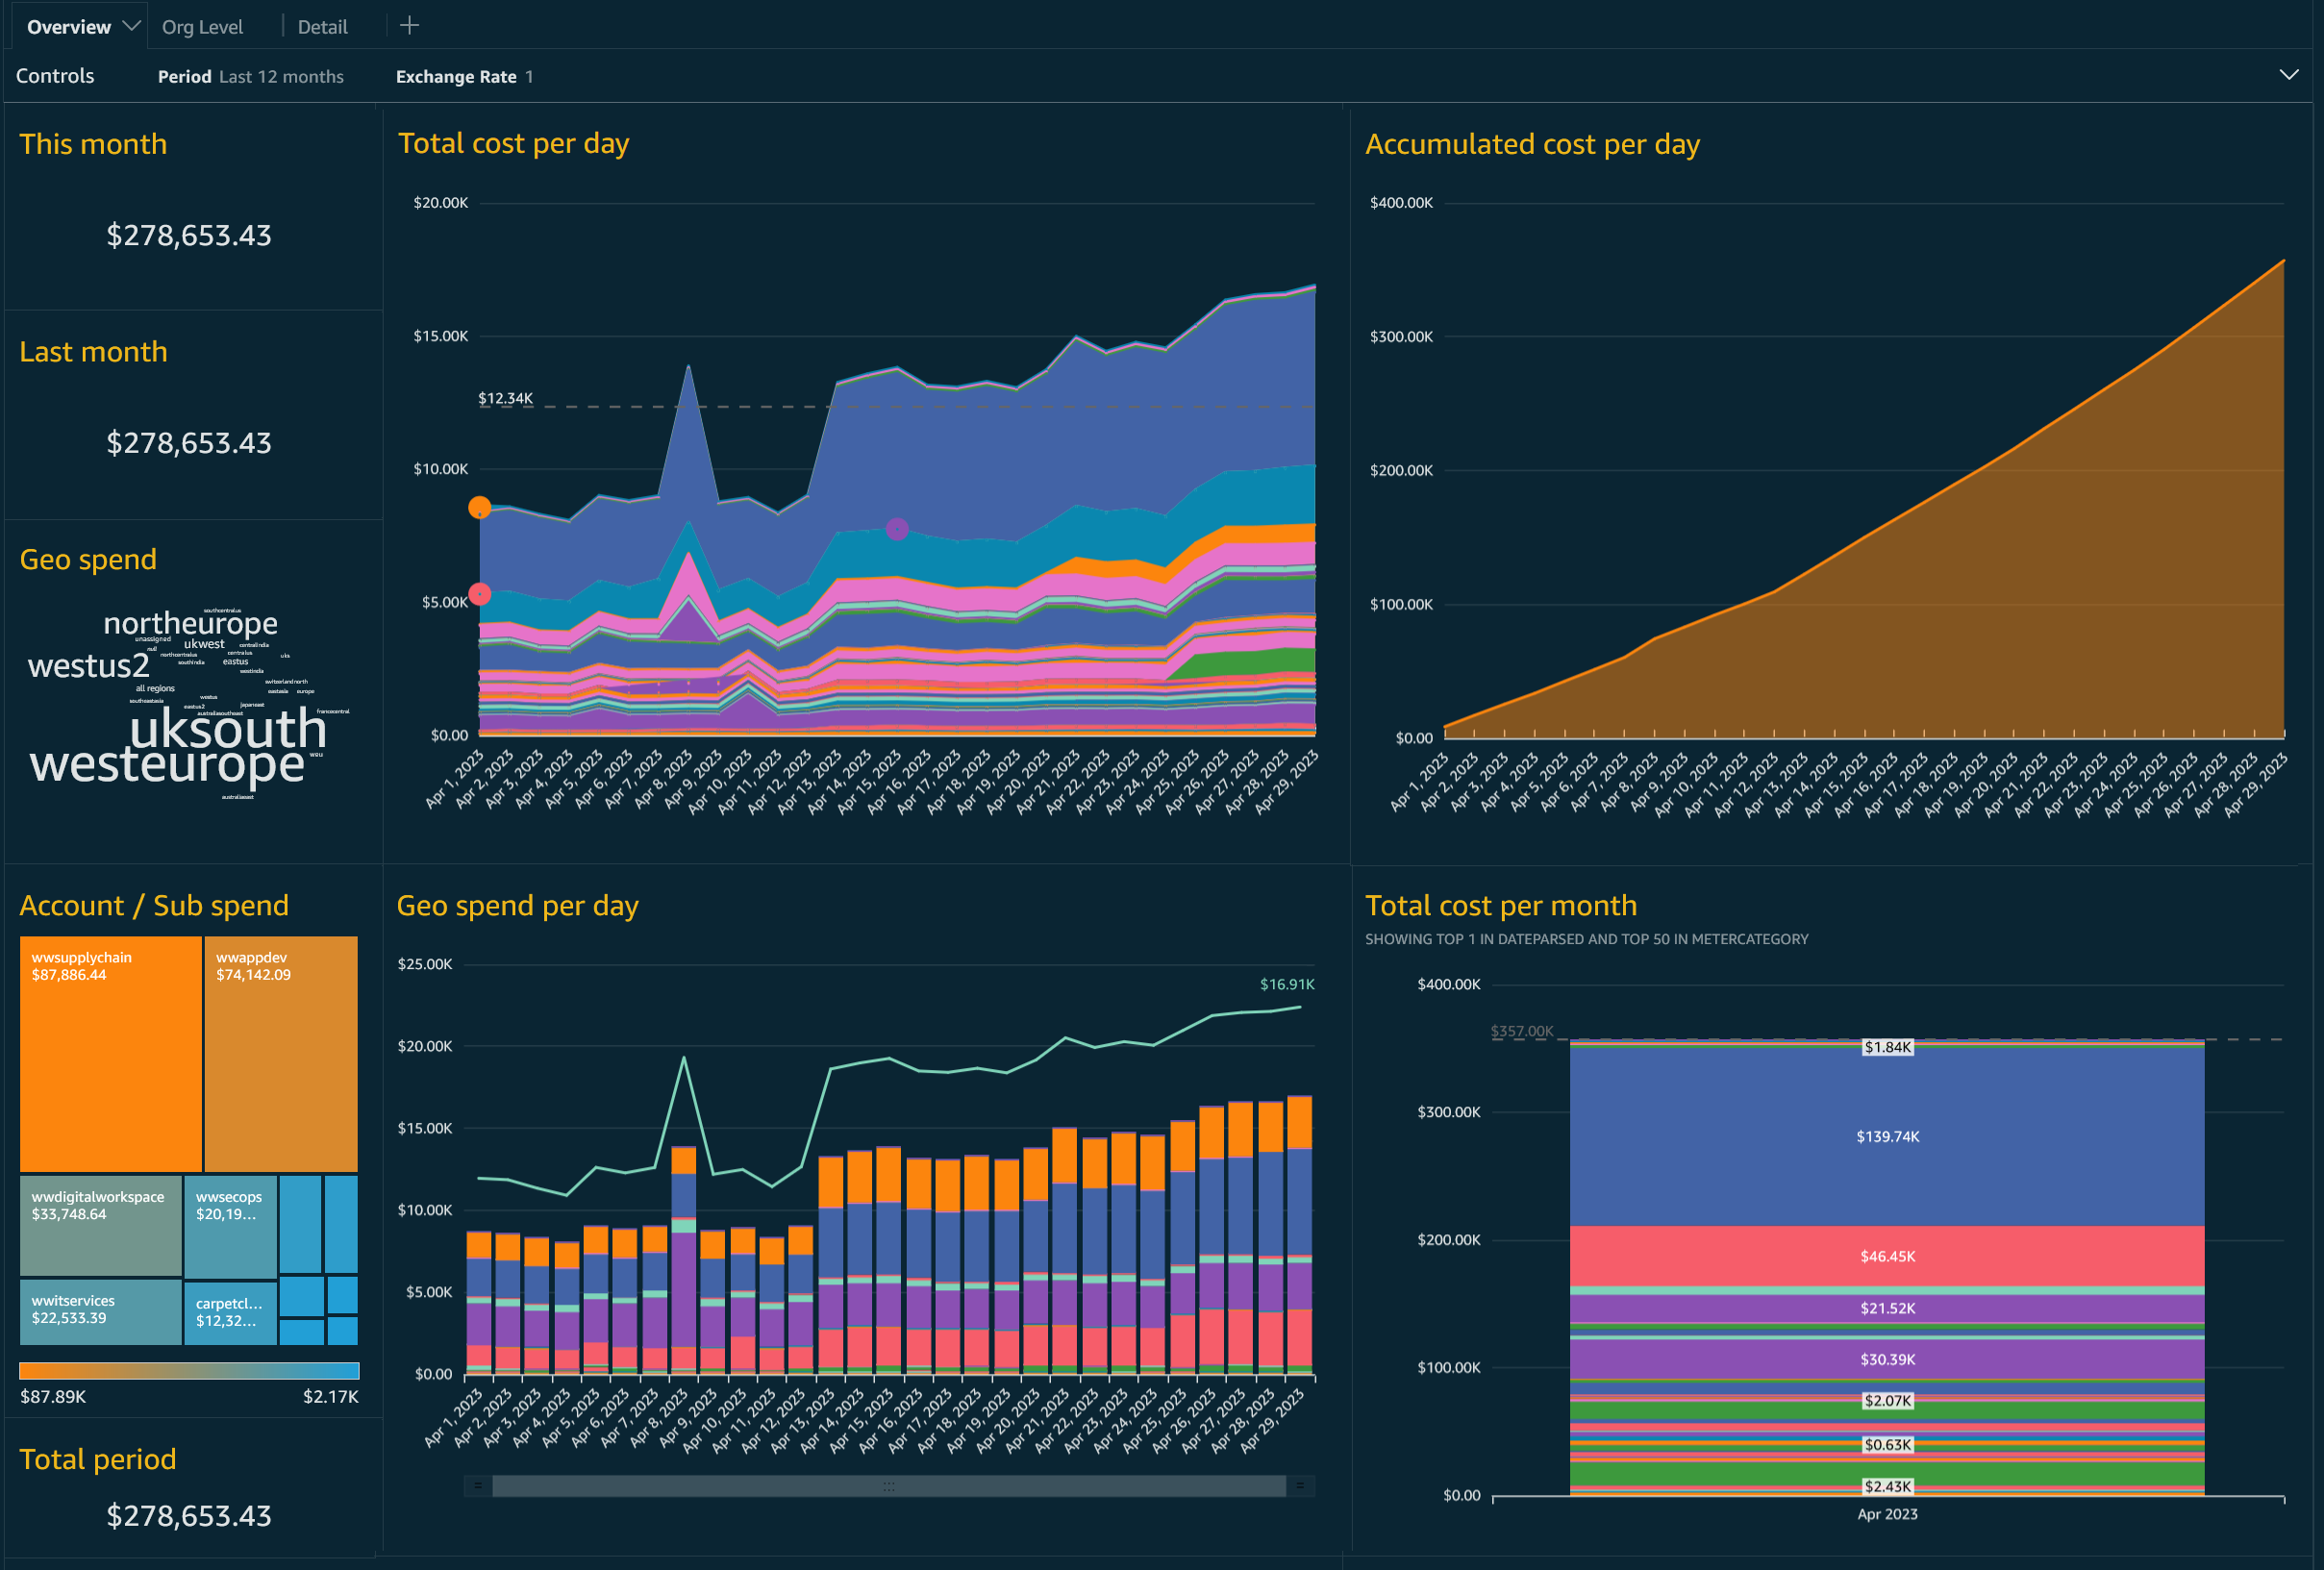 | Demo Details Deploy Feedback | Executives, Finance/Procurement, FinOps, Product Owners |